Intro to Data Gathering for the Project
In the previous post, the importance and potential risks of sand frac mining were discussed, as well as their ability to be analyzed in great detail with GIS software. To gain project-based experience that was relevant to this current issue, we were tasked to create the suitability and risk model for frac sand mining in Wisconsin. The first step in the process is to gather the necessary data. To understand the true impact of mining on the study area, a wide variety of base data was required, showing every type of feature that could be relevant to sand fracking. Because of the different types of data required for this project, multiple sources needed to be accessed in order to properly created the model. Data was acquired through multiple government sources, such as the Department of Natural Resources or the United States Geological Survey. The collection of base layers, while retrieved from different sources, were interoperable, and were able to be easily imported into ArcGIS, saving a considerable amount of time that would be otherwise spent normalizing and converting the files to be read together.
Data Gathering
When building a suitability and risk model to analyze the impact of frac sand mining, a number of base layers were required. The first step was to create a geodatabase to efficiently store the files that were to be downloaded, and ensure that everything was in the same projection. A specific projection provides the best results, so NAD83 UTM 15N was selected, giving the data the best possible representation. Next, a railroads shapefile was required for future network analysis of the impact of road degradation. To do this, the file from the National Atlas was downloaded. To analyze the potential issues with contamination of wetlands, the National Wetlands Inventory was consulted, with data downloaded specifically for Trempealeau County, which is where a large number of the sand mines are located. Land cover and elevation for the study area was obtained through the USGS National Map Viewer, which provided DEM raster files that required mosaicking them together to get a uniform image to be used for the model. Cropland data was provided by the United States Department of Agriculture Geospatial Data Gateway, and soil data was accessed through the Natural Resource Conservation Service's SSURGO service. Taken collectively, soil, cropland, railroad, wetland, land cover, and elevation data will provide the important first steps in the analysis of the impact of sand frac mining in the state of Wisconsin.Geocoding
In order to conduct a proper analysis of the sand frac mines, the current location of the mines needed to be recorded obtained. Initially, the Trempealeau County land records division website was consulted for mine locations in that particular county. More data was required to make an accurate model, however, so data for the entire state was necessary. An Excel table was obtained through Wisconsin Watch to complete this task. The next step was to geocode the location of the mines from the two sources. Geocoding is the process of matching addresses found in a table to locations on a map, with a point being plotted in each spot where a sand mine is located. The table from Wisconsin Watch had an address field in it, which would be used in placement of the mines. However, that field was not normalized, something that is absolutely essential in the geocoding process. In order for the point to be plotted in the correct place, all elements of an address (number, street name, city, state, zip code) needed to be in the same format. Unfortunately, the table had several input methods. Several had correct address elements, but many did not. The location of most of the mines were either incorrectly entered, in PLSS format, or only containing city or zip code values. Some of the mines even had no value entered in the table, making it impossible to even get a partial match with the geocoder.Due to the lack of table normalization, each mine needed to be manually checked if it was in the right location, or placed there through the use of image interpretation and other resources. If the location was entered in PLSS format, it was not guaranteed to be in the right area. In some cases, the geocoded point would be placed, but it would be located in the center of the nearest city, requiring manual placement. Out of the total 121 sand mine locations recorded on the table, 71 mines had incorrect fields that needed to be geocoded. As manually locating this many mines is an incredibly time consuming task, we teamed up in groups of four, and split the trouble mines among the group, giving each person around 18 mines to locate, a much more managable job. Figure 1 below shows a copy of the points I was tasked with finding, and gives a sample of the kind of table issues that occurred.
 |
| Figure 1: Table of points to be geocoded |
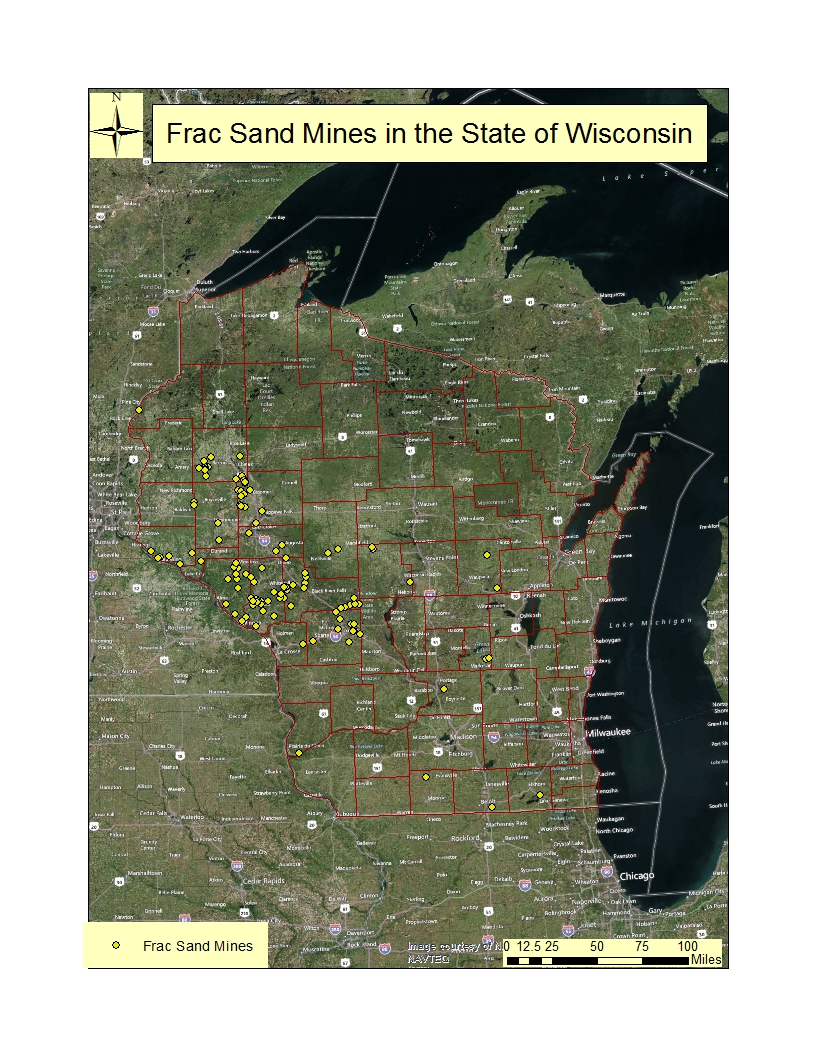 |
| Figure 2: Locations of sand mining facilities in the state of Wisconsin. Each yellow dot represents a mine. |
No comments:
Post a Comment